

Our latest industry research showed that in 2022, despite the challenges of the year, subscription merchants outdid their previous performance in five key metrics. Year-over-year, on average, AOV increased by 11%, LTV by 12%, and MRR by 7%—along with improvements in annual retention in monthly churn.
So—despite the hurdles of 2022, why did this growth occur specifically for subscription merchants? To answer this question, we looked at trends in subscribers’ behavior over the course of the year—including how many subscriptions they held, the product verticals these orders fell into, and how customers interacted with their orders.
In this blog post, we’ll cover the patterns we observed that shed light on 2022’s impressive subscription growth. Dive into the full analysis, complete with interactive charts, data visualizations, and other tools to help you benchmark your own business, in our 2023 State of Subscription Commerce report.
Key takeaways
- In 2022, the number of merchants a customer typically subscribed to increased year-over-year.
- When customers subscribed to multiple brands, they tended to choose merchants in the same product vertical.
- Actions to reduce customers’ spending, particularly order skips, increased in popularity.
Subscription adoption appeared to increase in 2022
To delve deeper into the “why” behind 2022’s phenomenal growth, we first dug into subscription adoption. We wondered: How many recurring orders did customers typically have? Was this number increasing? And how many merchants did customers typically subscribe to?
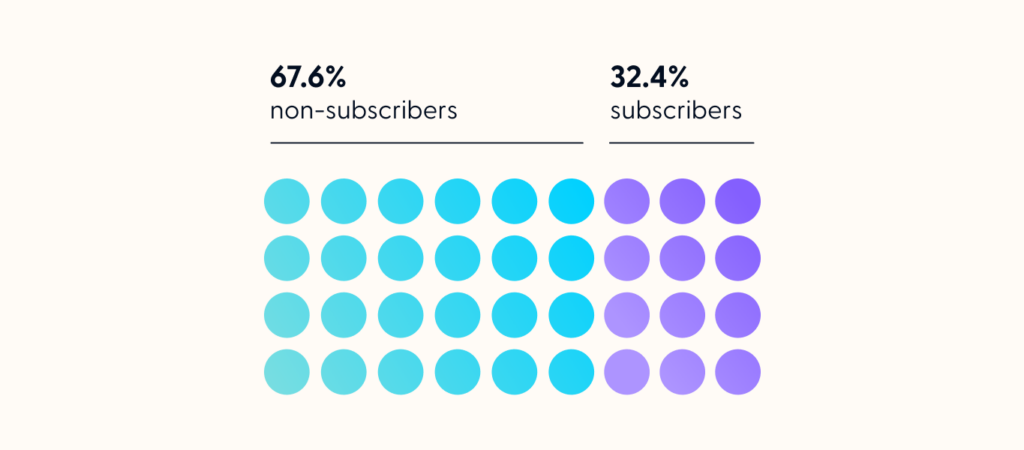
While the average number of subscriptions a customer had with a single merchant held steady in 2022, their adoption across merchants appeared to increase. Among the merchants we studied who offered subscription options, roughly one-third (32.4%) of customers were subscribers.
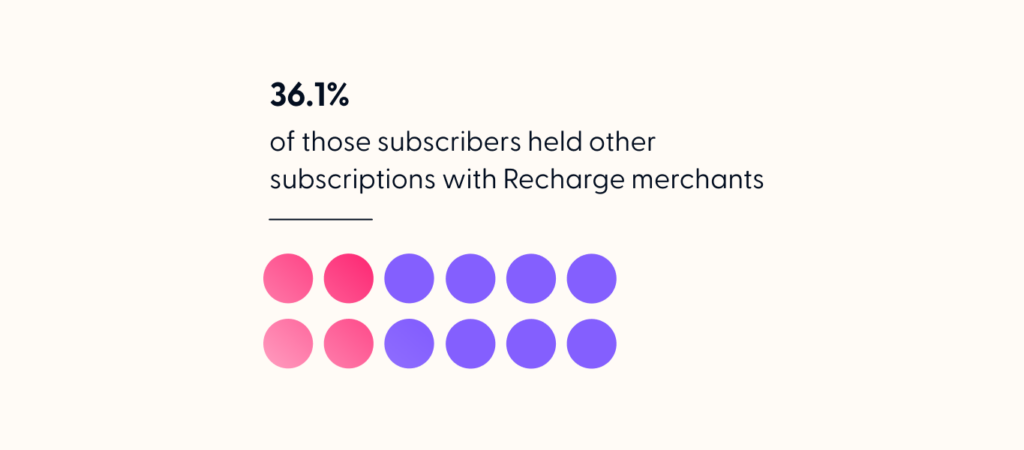
Within that 32.4%, the percentage of subscribers who held subscriptions with multiple merchants increased to 36.1%, compared to 31.3% in the previous year.
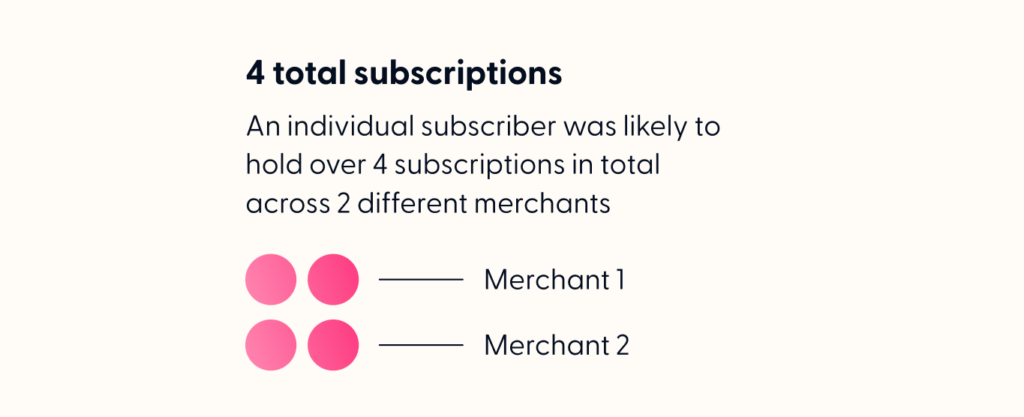
Most significantly, we saw a 14% year-over-year increase in the total number of subscriptions the average subscriber held in 2022. The typical customer had 4.1 subscriptions over the year, divided between an average of two different merchants.
In other words, in 2022, customers were seeking out more subscriptions from a greater number of providers to meet their needs. Subscribers didn’t just sign up for one recurring offering from a single merchant—their confidence in subscriptions as a purchase model appeared to increase.
“Today, the market has taken to the word ‘subscription.’ It’s common to sign up for multiple subscriptions, which makes it even more important for brands not to get lost in the mix.”
Ryan Fair, VP of Marketing & Ecommerce, Clearly Filtered
Subscribers often sought out multiple subscriptions in the same vertical
To gain further insight on this increased adoption, we looked at the types of subscriptions customers typically held. We wondered: What subscription products did customers typically pair with each other, and what could this tell us about the market’s growth?
What we found was that for the majority of product verticals, subscribers typically held multiple subscriptions in that same vertical. For example, Food & Beverage subscribers were more likely to hold another Food & Beverage subscription than one in any other product category.
This revealed a key growth opportunity for today’s subscription merchants: co-marketing with fellow merchants in your same vertical. Rather than seeing these brands as competitors, look at them as partners who can help you achieve new levels of success—and vice-versa.
Curious about the most common subscription pairings for your own vertical? Check out our interactive “build a subscription pair” tool in the subscriber behavior section of the report.
“Every week, someone used to go out to the grocery store and shop for their food. Now, ordering online is becoming a fundamental part of many people’s habits. As that trend continues, the industry will only continue to grow.”
Sam McIntire, Chief Revenue Officer & Co-Founder, Mosaic Foods
When it came to order modifications, product skips were crucial
Finally, we examined the ways that subscribers modified their orders over the course of the year. We know that flexible subscription management options like skipping orders, adding products, and swapping products are always key for customer satisfaction—but what specific actions were most popular in 2022?
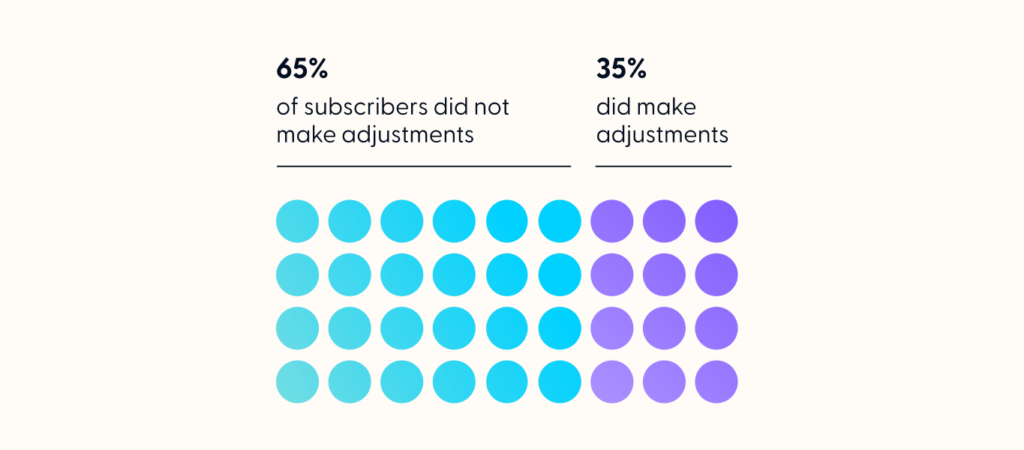
First, we looked at the percentage of customers who made adjustments to their orders in 2022. We found that over one-third (35%) edited their subscription in some way, be it skipping, swapping, or updating the frequency of an order.
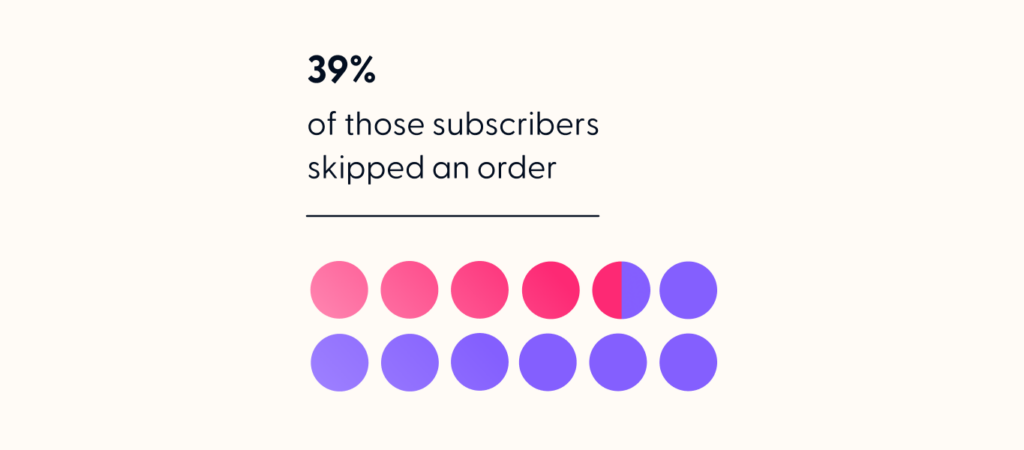
Within that 35% of customers who edited their orders, we saw a significant increase in the percentage of subscribers skipping an order. While in 2021, 32% of customers skipped an order, in 2022, this increased to 39%.
What this shows us: Especially in challenging economic times, customers value the ability to “trade down” their orders and reduce their spending while still remaining subscribed. To maintain long-term growth for your business, give customers the freedom to spend less with you when they need to. This not only empowers them to stick with you, but it also bolsters trust.
“Ecommerce is in its infancy, and there’s so much more flexibility coming into the subscription market. Ten years from now, you’ll be able to subscribe to new products in ways we can’t even imagine today.”
Sam McIntire, Chief Revenue Officer & Co-Founder, Mosaic Foods
Explore the report for more insights
Subscriber behavior was only one of the key pieces of the big picture we looked at for subscription merchants in 2022. Read the full, interactive 2023 State of Subscription Commerce report to learn how over 15,000 subscription merchants of all verticals and subscriber count ranges performed according to five KPIs: AOV, LTV, and MRR, as well as customer retention and churn.