

We’re thrilled to announce the launch of Recharge’s 2023 State of Subscription Commerce report!
With prices increasing across the board, merchants in 2022 needed to adapt to consumers’ changing budgets and needs. Despite these challenging economic circumstances, our analysis uncovered year-over-year improvement in several essential subscription metrics. This reinforces the stability that recurring purchase options provide for both those who purchase them and those who sell them.
“Subscriptions are becoming more than a habit—they’re becoming a way of life.”
Recharge’s 2023 State of Subscription Commerce report
This year’s interactive report contains key findings on subscription merchants’ performance in 2022. Drawing from our analysis of over 15,000 merchants and their active subscribers, we highlight improvements in five key performance indicators: AOV, LTV, MRR, customer retention, and customer churn.
To gain a deeper understanding of the “why” behind this growth, we also studied trends in subscriber actions over the course of the year, such as the types of products they subscribed to and the types of modifications they typically made to their orders.
Below, we’ve highlighted a handful of key findings from the report. Explore the full piece to see how merchants of all product verticals and subscriber counts performed in 2022, as well as key tactics that can be used in 2023 to achieve success.
How to read the report
KPI analysis & benchmarks
This year, our interactive report allows you to toggle between five different metrics to uncover subscription performance by AOV, LTV, MRR, customer churn, and retention.
Our KPI graph allows you to uncover how subscription merchants performed in 2022, both in terms of overall numbers and year-over-year growth percentages.
What’s more, you can click to filter the results according to seven product verticals and four subscriber count ranges to contextualize how different types of businesses performed in relation to each other.
The interactive graph is accompanied by detailed analysis on each metric. It’s paired with key strategies—with quotes from leading subscription merchants, including Mosaic Foods, AutoBrush, Drift, and Clearly Filtered—on how to achieve positive results for your own business in 2023.
We’ve also included a 2022 benchmarks chart summarizing the results of the data, so you can easily contextualize your store’s performance and identify top performing categories by both vertical and subscriber count.
Subscriber behavior
In the second half of the report, we explore trends in subscriber actions from 2022 to uncover why subscriptions grew the way that they did over the course of the year.
Insights we highlight include:
- The percentage of merchants’ customers who were subscribers
- How many subscriptions customers held on average
- The percentage of subscribers who held subscriptions with another merchant
- The specific modifications subscribers made to their orders
- And more
Key findings from the 2023 State of Subscription Commerce report
Below, we’re highlighting a handful of key insights from this year’s report. Explore the full piece to unpack more findings from the year, learn more about our methodology, and discover growth strategies you can apply to your own business.
Subscribers were likely to hold multiple subscriptions in 2022
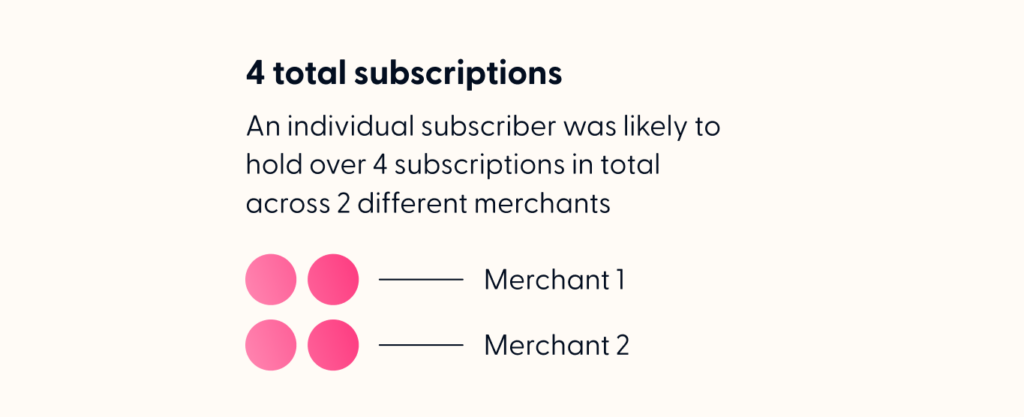
Our data uncovered that the average subscription customer held 4.1 total subscriptions in 2022—a 14% increase over the previous year. These subscriptions were likely to be divided between two different merchants on average.
In other words, in today’s market, subscribers appear to be using multiple subscriptions from a variety of different providers to meet their needs.
Subscribers often sought out other subscriptions in their same product vertical
We discovered that for the majority of verticals, subscribers were most likely to be subscribed to other products in their same vertical. For example, a customer subscribed to one Food & Beverage merchant was more likely to be subscribed to another Food & Beverage merchant than any other vertical.
In other words, partnering with merchants in your same vertical may help you achieve new levels of success, as their customers show a viable interest in your products, and vice-versa.
Use our interactive “Build a subscription pair” feature in the report to identify potential co-marketing opportunities for your business. Click around and see just how likely subscribers in each individual vertical are to be subscribed to another specific vertical.
AOV, LTV & MRR continued to rise

In 2022, AOV followed a similar growth pattern to the U.S. Consumer Price index for all goods and services, suggesting that inflation played a key role in this AOV growth.
However, it appeared that inflation wasn’t the only factor at play. Top-performing merchants also implemented key efforts to maintain their customers in the long-term, like providing subscription-on-first-purchase offers, offering multiple price points in different categories, and finding meaningful touchpoints of connection with their customers.
Year-over-year, subscription merchants saw an average of 12% LTV growth, 11% AOV growth, and 7% MRR growth.
Subscribers stuck around longer & in bigger droves than general ecommerce customers
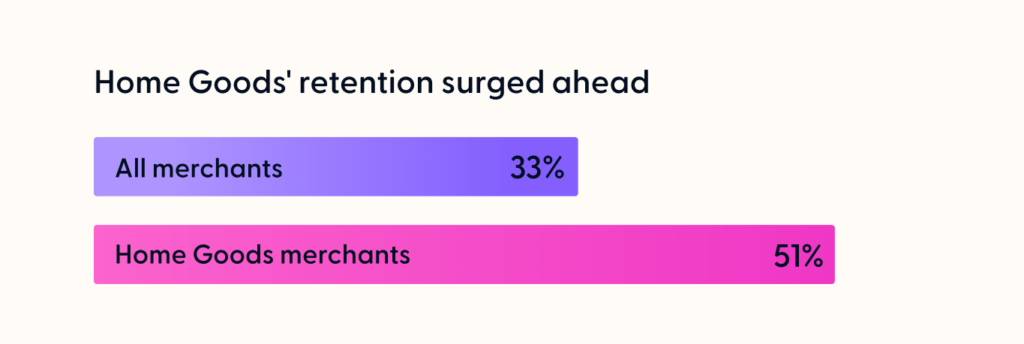
While the chances of an ecommerce customer returning to make another purchase drop to 20% after 200 days, we found that among the merchants we studied, subscribers were sticking around even longer and in bigger numbers.
In 2022, these subscribers held an average of 45% retention after 6 months, and 33% retention after 12 months. Some verticals, such as Home Goods, vastly surpassed the merchant average.
Customers required the ability to “trade down” their orders
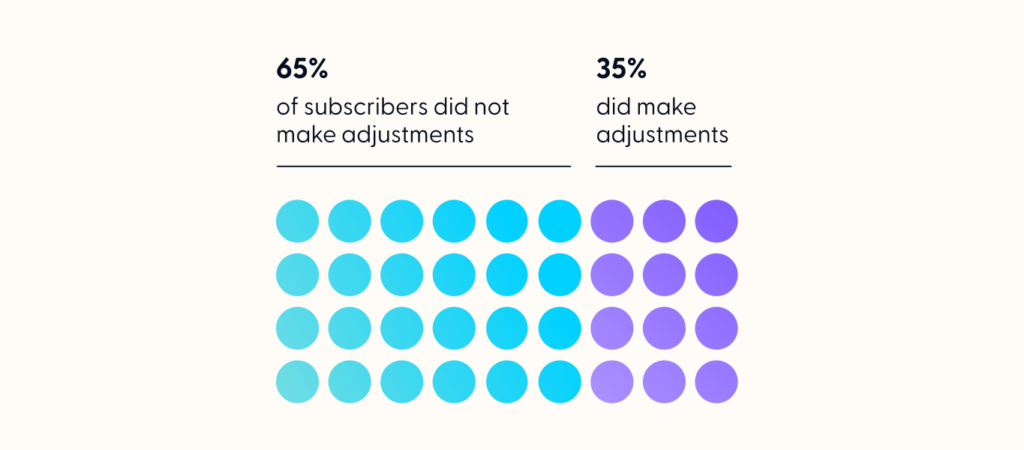
Making subscriptions flexible and easy to adjust is a tried-and-true strategy for retaining customers. However, in 2022, we found that it became even more crucial for subscribers to be able to adjust their orders—particularly with actions that allowed them to reduce the cost of the order.
In fact, we found that of subscribers who made changes to their orders over the course of the year, an impressive 39% of those individuals skipped an order. In tough economic times, these types of subscription management actions may help both merchants weather the storm together.
Subscription stability must be carefully cultivated
To maximize the stability that subscriptions can provide to both your business and customers, it’s crucial to center your subscribers, evolve to meet their changing needs, and rise to anticipate their future challenges.
Read the interactive report for the full insights on how subscription merchants performed in 2022, as well as key strategies you can apply to your own business to succeed in 2023.