

In order to maximize the benefits of the subscription business model, it’s essential to gain a baseline for your business. Not only should you understand how your store’s performance shifts and changes over time, but also how you stack up to others of your same size and vertical.
In our latest State of Subscription Commerce report, we break down the impact that 2021 had on subscription businesses across the world. What we found was that even as new challenges emerged, such as issues with shipping and logistics, subscriptions proved to be a stabilizing force for both merchants and consumers.
In our analysis, we studied 12,000 merchants serving 25 million total customers across 192 countries. We broke these merchants down into seven key product verticals: Food & Beverage, Home Goods, Health & Wellness, Beauty & Personal Care, Pets & Animals, Fashion & Apparel, and Other (which includes offerings like curated boxes of hobby items, outdoor equipment, and more).
Building off 2020’s unprecedented growth, 2021 saw positive growth across product verticals in terms of several key performance indicators (KPIs). Now, let’s dive deeper into some of those key subscription metrics.
Subscription KPIs & 2021 vertical performance
Here, we’ll focus on four major subscription business model metrics covered in the report: monthly recurring revenue (MRR), average order value (AOV), customer lifetime value (LTV), and customer retention.
Monthly recurring revenue (MRR)
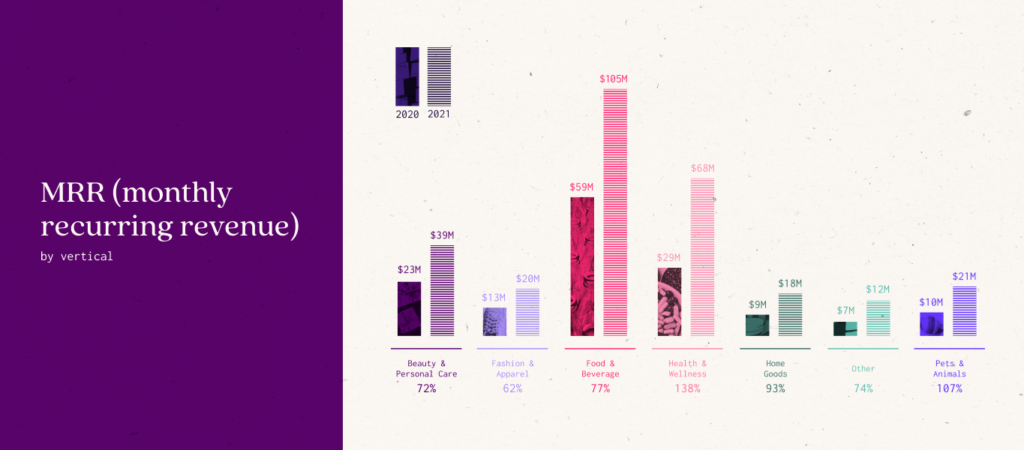
Recurring revenue is the lifeblood of subscription businesses. This makes MRR—the total revenue generated from subscription sales over a one-month period—one of the most critical metrics for subscription brands to track.
On average, in 2021, we saw 89% year-over-year growth in MRR. Every product vertical we studied experienced significant growth in this metric. Leading the pack was the Health & Wellness vertical at 138% year-over-year MRR growth, followed by Pets & Animals at 107%. In terms of overall MRR, Food & Beverage topped the charts.
Average order value (AOV)
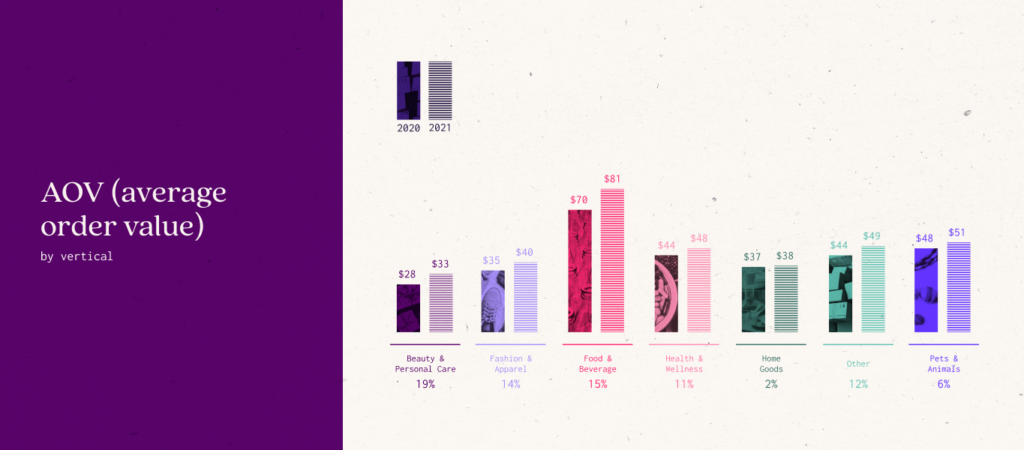
AOV doesn’t just tell a subscription brand the average amount their customers spend in a single transaction. Depending on the store, year-over-year AOV growth can indicate that offerings like one-time purchases or subscription upgrades are resonating more deeply with customers, making it a crucial metric to track over time.
All verticals experienced AOV growth in 2021, with an average of 11.2% year-over-year growth; however, this varied significantly from category to category. Beauty & Personal Care subscriptions saw the greatest year-over-year growth at 19%, followed by Food & Beverage (15% growth), which also maintained its status from 2020 as the vertical with the highest overall AOV.
Customer lifetime value (LTV)
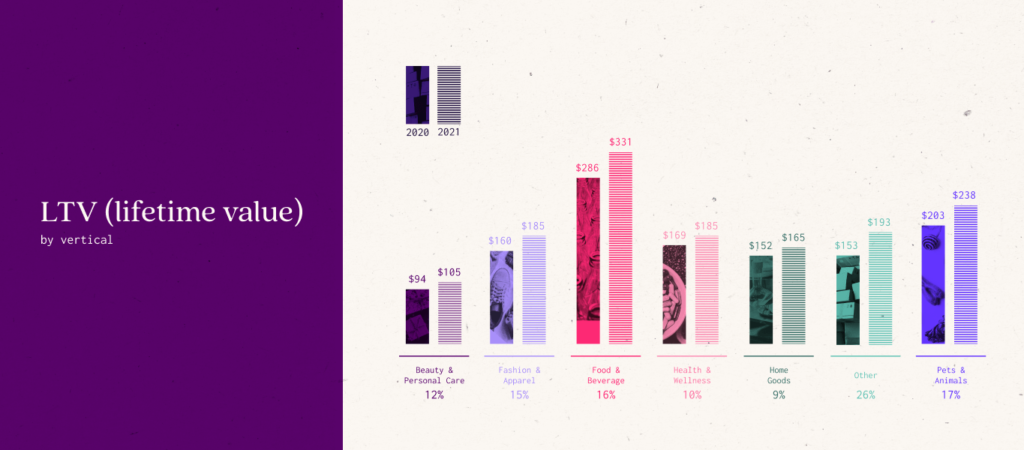
LTV—the profit a single customer brings in throughout their customer lifetime with a merchant—is important for assessing the longevity of subscription offerings. After all, year-over-year LTV growth can be a strong indicator of customer loyalty.
In 2021, we found that on average, subscription merchants experienced a 15% year-over-year increase in LTV. The vertical with the highest LTV growth was Other at 26%, followed by Pets & Animals at 17%. As seen with AOV, the vertical with the highest overall LTV was Food & Beverage.
Customer retention
According to the Harvard Business Review, the cost of acquiring a new customer can be anywhere from 5 to 25 times greater than that of retaining an existing one. As average customer acquisition cost (CAC) continues to rise, it’s crucial to focus on retaining your existing customers and reducing your customer churn rate as much as possible.
When looking at retention across verticals in 2021, we discovered that different verticals led the pack for customer retention over different lengths of time:
- After 1 month, Fashion & Apparel held the highest customer retention at 87%
- After 6 months, Beauty & Personal Care held the highest customer retention at 54%
- After 12 months, Home Goods held the highest customer retention at 42%
These retention rates are especially impressive when compared to the average monthly user retention rate of ecommerce in general of just 1%. When your subscribers stick around, they have the power to create a lasting positive impact on your business.
Looking for more key takeaways for your subscription business? Download the free report
Looking for a full vertical breakdown on each of these metrics, plus others? Our 2022 State of Subscription Commerce report contains a wealth of in-depth analysis on the state of the industry today, including merchant performance by GMV (gross merchandise value) range, integration usage, and key takeaways for merchants of varying sizes to apply to their own business for future success.